Feeds:
Posts
Comments

Archive for the ‘MarketView’ Category

MarketView – September 11, 2013

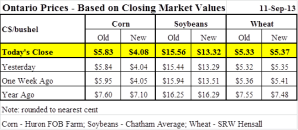
Sept 11 chart

Market Drivers:

• The expectation (based on average trade guesses) that the USDA will reduce its US corn and soybean yield forecasts in tomorrow’s (Thursday) WASE report
• The expectation (based on average trade guesses) that the USDA will reduce its World and US corn and soybean stocks in tomorrow’s (Thursday) WASE report
• Concern of the impact an early frost would have on crop yield – gets less as time moves closer to harvest
• A widely variable U.S. crop

Great Lakes Grain, AGRIS Co-operative, FS PARTNERS Crop Assessment Tour Report• Estimated this year’s average corn yield across the southwest and central part of Ontario at 160.8 bushels/acre and the soybean yield at 45.6 bushels/acre
• This compares to last month’s Statistics Canada projections of 154.8 bushels/acre for corn and 43 bushels for soybeans for the whole province as opposed to the regions assessed by Great Lakes Grain
• Check out the report at http://aghost.net/images/e0015001/GreatLakesGrain2013CropAssessmentTourSummarySeptember102013.pdf
• Provides more detailed yield information and crop conditions observed during the tour held from September 3rd to 6th

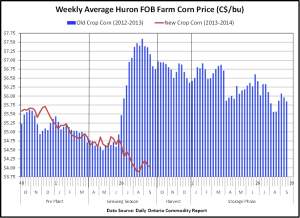
Sept 11 graph

The above graph is based on weekly average Huron FOB Farm corn market prices:

  • It compares old crop corn (2012-2013) being sold out of storage (blue bars) with new crop corn (2013-2014) that will be harvested this fall (red line)
  • The time period shown for each crop year is a two year period from pre-plant, growing season, harvest and storage
  • The old crop corn is from October 2011 to September 2013 and the new crop corn is from October 2012 to September 2014

Disclaimer: This commentary is provided for information only and is not intended as advice
Read Full Post »

MarketView – September 4, 2013

Sept 4 table

Market Drivers:
• Weather varying from hot and dry to cool and wet
• USDA’s lower yield estimates for new crop in the August WASDE report (next report out September 12th)
• Concern of the impact an early frost would have on crop yield
• A widely variable U.S. crop
• Farm Futures reports today that wet corn (30%+) is being harvested in southern Illinois as early deliveries in search of the basis strength has begun.

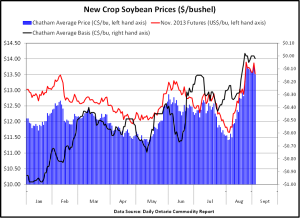
Sept 4 graph

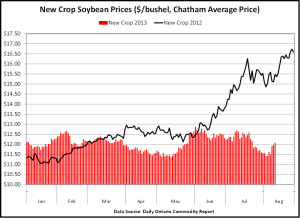
The above graph is based on daily market prices for 2013 soybeans (the crop about to be harvested):• The new crop (2013) Chatham Average Soybeans price is shown with the blue bars.
• The blue bars are the combination of the Nov. 2013 Soybean Futures shown by the red line and the Chatham Average Soybean Basis is shown by the black line.
• The Chatham Average Soybean Price and the Nov. 2013 Soybean Futures are read from the left hand axis.
• The Chatham Average Soybean Basis (black line) is read from the right hand axis.
• The sharp rise in the futures and the Chatham Average Price since the end of July has been driven in part by the reaction to the observed weather impacts on
the soybean crop during August and the concern for potentially tighter ending stocks than reported in the August WASDE report.
• One of the drivers of the basis is the value of the Canadian dollar. In January the dollar was about at par with the US Dollar and currently is about 95 cents compared to the US dollar.

Disclaimer: This commentary is provided for information only and is not intended as advice
Read Full Post »

MarketView – August 14, 2013

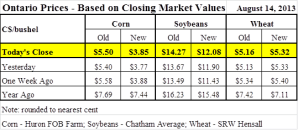
aug 14 chart

Impacts on the Current Future’s Market Prices for Corn and Soybeans:

  • Slightly tighter new crop supplies due to reduced new crop yields were reported in the USDA Supply & Demand Report which were below pre-report expectations.
  • Weather
  • Export sales  

aug 14 graph

Some highlights from the Ag Canada Report Outlook for Principal Field Crops released on August 13, 2013

In general World grain prices for the crop year 2013-14 are expected to decline due to increased production being supported by normal to above-normal growing conditions across the major grain producing countries. In Canada, the grain and oilseed prices are forecasted to average 10 to 20 percent lower than 2012-13 due to lower international prices. Canadian prices may receive some offsetting support from a weaker Canadian dollar.

Soybeans:

  • The  2012-13, domestic crush is expected to rise to 8 year highs, exports are expected to set a new record and Chatham track prices are forecasted to average  $533/tonne ($14.50/bushel)
  • The  2013-14, planted area in Canada is estimated at a record 1.86 million hectares. This makes soybeans the 5th largest crop by area in Canada. The forecasted Chatham average soybean price is $420-460/tonne ($11.40 to $12.50 per bushel)
  • World soybean production is forecasted to rise based on an expected record production in the United States, Brazil and Argentina (289 million tonnes, up from 285 million tonnes). World soybean carry-out stocks are forecast at a record 74 million tonnes which gives a stocks-to-use ratio of 21% for 2013-204 versus 19% for the 2012-13 crop year.

Corn:

  • For 2012-13, Canadian corn exports are forecasted to increase to 1.2 million tonnes due to tight supplies in the U.S. and a very wide Ontario corn basis. The nearby Chatham in-store elevator price was record high for the past crop year because of steady total domestic use and strong US corn futures prices.
  • The forecasted 2013-14, seeded area in Canada is for an increase of 3% from the previous record of 2012-13. The forecasted production is up 1% to 13.2 million tonnes based on the larger area and the return to average yields. Total supply is forecasted to increase 2%, total domestic use is forecasted to increase by 1%, exports are forecasted to decrease due to a recovery in U.S. corn production and lower world prices and the carryout stocks are forecast to increase to a new record of 2.4 million tonnes. With the potentially larger North American and world corn crop for 2013, the Chatham in-store elevator price is forecasted to decrease ($4.40 to $5.20 per bushel).

Disclaimer: This commentary is provided for information only and is not intended as advice

Read Full Post »

MarketView June 6, 2013

Statistics Canada released the Farm Product Price Index for March 2013 yesterday:

What is the Farm Product Price Index (FPPI)? Here is the explanation provided by Stats Canada:
The Farm Product Price Index (FPPI) measures the changes in prices that farmers receive for the agriculture commodities they produce and sell. Commodities are priced at point of first transaction, where the fees deducted before a producer is paid are excluded, but bonuses and premiums that can be attributed to specific commodities are included.
The price index has separate crop and livestock indexes, a variety of commodity-group indexes such as cereals, oilseeds, specialty crops, cattle and hogs and an overall index – all available monthly and annually for the provinces and for Canada.
The FPPI is an important indicator of the economic activity in the agriculture sector. Agriculture economists and analysts interested in the health of the agriculture sector, deflating agricultural commodity prices and policy development, use the series.
The information provided by FPPI is useful to producers, producer groups, commodity analysts from the private sector such as grain companies and meat processors, international exporters, the banking sector and government agencies responsible for agriculture policies. The index compares, in percentage terms, current farm prices to prices in the time base period, 2007=100.

Statistics Canada reported the March 2013 FPPI as follows:
The Farm Product Price Index (FPPI) rose 2.4% in March compared with March 2012, as an increase in the crops index more than offset the decrease in the overall livestock and animal products index.
The FPPI, driven mainly by rising crop prices, has observed year-over-year increases since August 2010. Double digit increases were recorded up to January 2012; since that time, the rate of growth in the FPPI has slowed.
The crops index rose 6.8% in March compared with March 2012, largely as a result of the higher oilseeds index (+11.8%), which continued a growth trend that started in September 2010.
Declines in the hogs index (-10.5%) and the cattle and calves index (-4.4%) were responsible for the decrease in the livestock and animal products index.
The FPPI was 128.9 for March 2013 compared to 125.9 in March 2012. This means compared to the base period of 2007 that overall prices were 28.9 % better in March 2013.
The crops FPPI was 133.6 and the livestock and animal products FPPI was 124.3 in March 2013 compared to 125.1 and 127.3, respectively in March 2012.
Check the full report at http://www.statcan.gc.ca/daily-quotidien/130605/dq130605b-eng.htm

Disclaimer: This commentary is provided for information only and is not intended as advice
Read Full Post »

MarketView – June 4, 2013

US Crop progress report:
Corn planting was in line with the expectations at 91% complete which is up 5% from last week and last year at this time planting was completed.
Soybean planting was on the lower end of expectations at 57% complete but up 13% from last week. Last year it was 93% completed and the 10 year average is 79%.
Spring wheat planting is 80% complete

US Crop Conditions
Corn was rated at 63% good/excellent which compares to 72% last year and 69% on 10 year average.
Winter wheat was rated at 32% good/excellent which compares to 52% last year and 47% on 10 year average.

Crop Prices:
Old Crop Corn closed yesterday at $6.5575 and New Crop Corn at $5.60
Old Crop Soybeans closed yesterday at $15.3250 and New Crop Soybeans at $13.2550
Wheat closed at $7.0875
Hamilton Soybean Meal was $574 to $583 per tonne
Corn, Soybeans and Wheat were all lower in the overnight market as of 6 am this morning, 3 cents, 10 cents, and 8 cents per bushel, respectively.

In the News:
The Andersons, Inc. and Lansing Trade Group announced yesterday they had entered into an agreement to acquire Thompsons Limited, a grain and food-grade bean handler and agronomy input provider, headquartered in Blenheim, Ontario, and operating through 12 locations across the province and in Minnesota. The acquisition is subject to certain customary closing conditions and is expected to close at the beginning of the third quarter. Further information at http://www.farms.com/news/thompsons-to-be-acquired-by-anderson-s-lansing-63259.aspx . Check out http://www.andersonsinc.com and http://www.thompsonslimited.com for information on the companies involved.

Crop Graph:
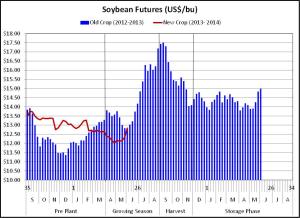
To get your local soybean spot price, simply add your local basis
• i.e. new crop future $13.2550 + local basis of -$0.39 = $12.87/bu or $472.83/tonne

soybean futures

Disclaimer: This commentary is provided for information only and is not intended as advice
Read Full Post »

MarketView – May 30, 2013

Bank of Canada Keeps Overnight Rate at 1%
As anticipated the Bank of Canada kept the overnight rate at 1% where it has been since September 2012. The longest period of time since the 1950’s. The statement indicated that “considerable monetary policy stimulus currently in place will likely remain appropriate for a period of time, after which some modest withdrawal will likely be required.” Justification for keeping rates the same were a continued slack economy, slower Canadian household debt build up, and a muted outlook for inflation. The statement also noted that Canadian exports will continue to struggle due to competitive challenges with the strength of the Canadian dollar and tempered foreign demand, but that exports are expected to recover over time. The next scheduled date for announcing the overnight rate target is July 17, 2013. The next full update of the Bank’s outlook for the economy and inflation, including risks to the projection, will be released at the same time.

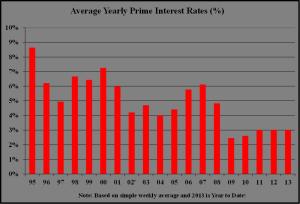
The graph below shows the yearly trend of the prime interest rates impacting Canadian consumers and businesses.

Prime Interest Rate

Disclaimer: This commentary is provided for information only and is not intended as advice
Read Full Post »

MarketView – May 29, 2013

USDA Crop Progress Report – May 26, 2013
• Corn planting was 86% complete which is up 15% from last week. This compares to 99% last year and 92% complete on 10 year average. The market expectation was near 85%.
• Soybean planting was 44% complete which is up 20% from last week. This compares to 87% last year and 65% complete on 10 year average. The market expectation was near 40%.
• Spring wheat was 79% complete which is up 12% from last week. This compares to 100% last year and 89% complete on 10 year average.
• Winter wheat condition was 31% good/excellent which is the same as last week

Crop Graph:
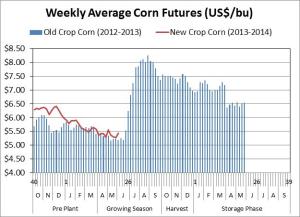
• To get your local corn spot price, simply add your local basis
• i.e. new crop future $5.51 + local basis of -$0.75 = $4.76/bu or$187.39/tonne

Weekly Average Corn Futures

Livestock
• US released the final rules to modify Mandatory Country of Origin Labelling (COOL) last week on May 23rd. The two major changes from the initial rule are the required labels are to include information about where each of the production steps occurred and it removed allowances for commingling of muscle cuts. The new labeling requirements go into effect on May 23, 2013 but there is a 6 month education and outreach program which means 100% compliance requirements will be delayed for six months. Both Canada and Mexico have stated they believe the amended rules still violate the World Trade Organization agreements and are prepared to take addition actions.
• Smithfield Foods Inc. (SFD) has confirmed that it has agreed to be acquired by Chinese meat producer Shuanghui Group for about $4.8 billion.

Disclaimer: This commentary is provided for information only and is not intended as advice
Read Full Post »

MarketView for May 17

Global markets are trading higher this morning as investors expect healthy US consumer sentiment data to be released later this morning.

The Canadian dollar has been in retreat overnight following comments from the US central bank indicating that their monetary easing program could cease as early as this summer. Our dollar is currently trading at $.97

Crops:
Corn has some downward price momentum this morning as it is likely that this week will mark a US corn planting record, according to Agrimoney.com Soybeans are trading higher in the early session as yesterday’s USDA export showed that China purchased 79% of the US soybeans sold last week, confirming an increase in demand, and a growing belief that the push in corn plantings will have a negative impact on soybean production, according to a commodities analyst quoted in Bloomberg Financial.

Disclaimer: This commentary is provided for information only and is not intended as advice.

Jennifer Stevenson
Manager (A) Sustainable Livestock Production Unit
Ontario Ministry of Agriculture and Food
Ontario Ministry of Rural Affairs

Email: Jennifer.stevenson@ontario.ca

Read Full Post »

Initial market reaction:  Bearish soybeans (especially new crop), bearish corn (especially old crop)

Corn

Actual                   Expected

US Ending stocks (2012/13)                          759                         754 million bushels

US Ending Stocks (2013/14)                         2.004                     1.97 billion bushels

Global Ending Stocks (2013/14)                  154.6*                   151.7 million tonnes

*13 year high

USDA average season price prediction of $4.30 to $5.10 per bushel

Soybeans

US Ending stocks (2013/14)                          .265                        .239 billion bushels

Global Ending stocks (2013/14)                  82.6                        70 million tonnes

USDA average season price prediction of $9.50 to $11.50 per bushel

Livestock futures have not changed direction since the open

Disclaimer: This commentary is provided for information only and is not intended as advice
Jennifer Stevenson

Manager (A) Sustainable Livestock Production Unit

Economic Development Division

Ontario Ministry of Agriculture and Food

Ontario Ministry of Rural Affairs

Tel: 519-826-3291

Email: Jennifer.stevenson@ontario.ca

Read Full Post »

MarketView-May 3

Global markets are trading slightly higher this morning. US unemployment for April drops to 7.5% (a 4 year low) and better than expected job growth while the European economy is headed for further slowdown and slower deficit cuts, according to Reuters

Crops:
Crops futures are trading modestly higher in the early session as investors express concerns that continued cold temperatures and snow forecasts across the US Midwest will put a dent into yields, according to Agrimoney.com. A 5% week-over-week gains in US export corn sales may also be a factor in this morning’s positive momentum.

Livestock:
Live cattle futures are showing some pull-back this morning after yesterday’s positive gains.

MarketView is prepared by Jennifer Stevenson, Ontario Ministry of Agriculture and Food and Ministry of Rural Affairs. Disclaimer: This commentary is provided for information only and is not intended as advice
Read Full Post »

Older Posts »